
The statistics URLs provide status indicators about events, such as error and warnings, that have occurred in a predefined period of time. These URLs contain JSON attributes so can be used only by monitoring tools that support JSON.
The statistics URLs are located below:
http://[primary_server]:[port]/api/stats
EXAMPLE
The following statistics URLs are available:
| URL | Attribute | Description |
|---|---|---|
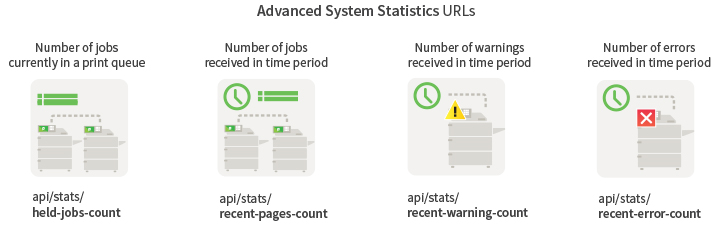
| /held-jobs-count | status | The number of jobs currently held in any print queue. This value is updated every 10 seconds. Use this data to graph your hold\release print queue load to see trends over time and identify possible issues. |
| /recent-pages-count?minutes=1 | status | The number of pages printed from all printers in a defined period of time. The default time period is 1 minute, however, you can change this to a value up to 240 minutes by changing the ?minutes=240 value. Use this data to graph your printing output to see trends over time and identify possible issues. |
| /recent-errors-count?minutes=10 | status | The number of errors that have occurred on all printers in a defined period of time. The default time period is 10 minutes, however, you can change this to a value up to 240 minutes by changing the ?minutes=10 value. Use this data to graph the error frequency to see trends over time and identify possible issues. |
| /recent-warnings-count?minutes=10 | status | The number of warnings that have occurred on all printers in a defined period of time. The default time period is 10 minutes, however, you can change this to a value up to 240 minutes by changing the ?minutes=10 value. Use this data to graph the error frequency to see trends over time and identify possible issues. |
Comments