
SandComp is a large manufacturing company consisting of 3000 employees. They have a head office with an Application Server and three distributed branches, each with a Site Server. All sites are connected via a fast Wide Area Network (WAN). Printers are hosted on local servers.
Sandcomp would like to set up the following monitoring activities:
- Immediate notification when the database is not connecting to the Application Server
- Immediate notification when a Site Server is offline
- Notification when any printer is in error for more than 10 minutes
- Notification when the Administration Department printer has not had a print job for more than 60 minutes during business hours
- Notification when the number of users falls below a threshold
- Real-time graphical presentation of the number of pages printed over time
-
Requirement 1: Immediate notification when the database is not connecting to the Application Server
Sandcomp wants an immediate email notification when the Application Server cannot connect to the database.
Configure the following in your monitoring tool:
The monitoring tool will trigger an email alert and display a visual representation of the alarm on the dashboard. The following example shows that the HTTP response status code for the endpoint is 200 (OK) as it is green.
-
Requirement 2: Immediate notification when a Site Server is offline
Sandcomp would like to generate an email when any of the Site Servers is offline. This will allow them to resolve any issues immediately rather than waiting for the issue to be reported.
The following image is an example of an error indicator on a monitoring tool dashboard. This example indicates that there is an error (red) and a Site Server is offline.

You can set up this notification in a couple of different ways, depending on the capabilities of your monitoring tool.
Option 1:
If your monitoring tool cannot consume JSON text, you can use the HTTP response status code for the following URL. This endpoint indicates whether any Site Servers are offline, but does not indicate which Site Server.
Configure the following in your monitoring tool:
Option 2:
If your monitoring tool can consume JSON data, you can set up an alarm for each individual Site Server.
Configure the following in your monitoring tool:
This endpoint indicates whether a specific Site Server is offline. Use the sensor name to indicate the Site Server to which the sensor applies.
-
Requirement 3: Immediate notification when any printer is in error
Sandcomp would like to know if any printer has a problem for more than 10 minutes, such as being offline or out of paper. You don’t want to trigger an immediate alarm as you want to allow time for someone to fix the problem, for example, refill the paper. The time period to wait before the alarm is triggered is set up in your monitoring tool.
You can set up this notification in a couple of different ways, depending on the capabilities of your monitoring tool.
The following image is an example of an error indicator on a monitoring tool dashboard. This example indicates that there is an error (red), which means the printer is offline.
Option 1:
If you just want to know the number of printers that are offline, configure the following in your monitoring tool:
This endpoint does not indicate which printers are offline.
Option 2:
If you want to know which printer is offline, set up an alarm for every printer using the HTTP response status code for the following URLs. This endpoint indicates whether or not a specific printer (identified by the printer Id) is offline.
Configure the following in your monitoring tool:
-
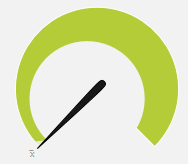
Requirement 4: Notification when the administration printer has not had a print job for more than 60 minutes during business hours
Sometimes a printer might not be available for reasons other than the printer being offline or in error; for example, the card reader might be broken. At Sandcomp, the Administration Department printer is used constantly so if there is no print job in a 60-minute period, there is a high chance of there being a problem with the printer. Sandcomp would like to be notified if a printer has not had a print job for more than 60 minutes between 8 am and 6 pm. You need to specify the time period of 8 am to 6 pm in your monitoring tool.
Configure the following in your monitoring tool:
If the Administration Department printer is online, the monitoring tool dashboard will display a visual representation similar to the following. In the example below, the printer is online, so the gauge is green.
-
Requirement 5: Notification when the number of users falls below a threshold
Sandcomp is growing rapidly and would like to avoid the situation where new employees start, but cannot print because their current subscription/license does not cover the number of users they require. They would like to receive an email notification when they have only 10 unclaimed users on their subscription/license.
Configure the following in your monitoring tool:
The image below shows what this alarm might look like on a monitoring tool dashboard. This example indicates that there are fewer than 10 unclaimed users remaining, so the alarm has been triggered (red).
-
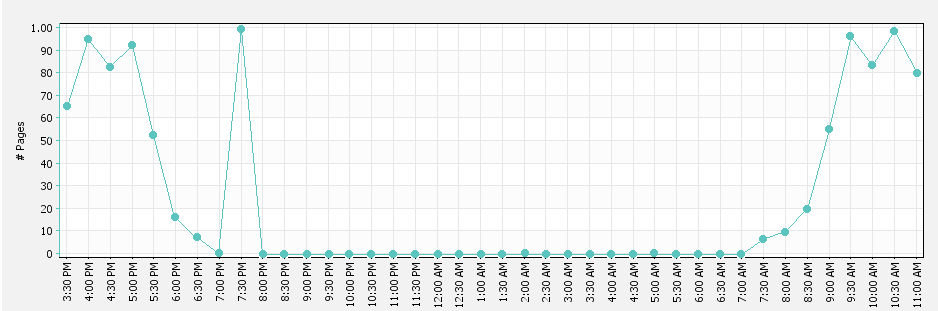
Requirement 6: Real-time graphical presentation of the number of pages printed over time
Plot a real-time graph of the number of pages printed every 30 minutes. This allows Sandcomp to monitor spikes or dips in printer use so that they can respond appropriately when these trends are out of the norm.
Configure the following in your monitoring tool:
The following graph shows an example of this attribute in a monitoring tool. In the example below, there was a peak at approximately 7.30 pm, which is after business hours, so you might want to watch if this becomes a pattern.
Comments