
Advanced Health Monitoring using PRTG
THE PAGE APPLIES TO:
Last updated October 15, 2025
In PaperCut 16.1, we’ve enhanced the Print System Health interface.
Maximize your print uptime by proactively maintaining your print environment using PRTG. You can:
- trigger alarms as soon as outages occur rather than waiting for someone to report an issue
- monitor real-time printing activity to identify changes in printing behavior
- monitor trends in printing resources and usage over time so you can plan for expansion to address bottlenecks before they occur.
- monitor printer and device inactivity
For the experienced sysadmin, we’ve put together a set of advanced monitoring interfaces for you to query against.
These advanced monitoring interfaces return JSON for your monitoring tool to parse. This lets you choose exactly when you want to be alerted to potential concerning incidents in your print environment.
For more information on the types and use of these URLs (endpoints), see the PaperCut manual.
To demonstrate using PRTG Network Monitor and the simple Print System Health interface at a high level, you will set up a sensor to monitor the overall state of your PaperCut Server license or subscription. You should get a green [ok] or red [error] status from PRTG once you have finished.
To achieve this you need to complete a few overall tasks:
- Check your server access
- Download and install PRTG on an appropriate server.
- Create a device as a means to group your sensors.
- Create a sensor to monitor a status endpoint of the server.
- Set up notifications.
- Configure the mail server settings in PRTG if needed.
Step One
Pick a server in your environment that has network visibility of the PaperCut server you want to monitor.
Put simply, the server needs to be able to successfully access this URL: http://serveraddress:9191/api/health/license/status
If you’re running PaperCut 16.1 or later, the server is online, and you can’t access this URL, check that:
- The hostname can be resolved by your DNS (or that the IP address is correct)
- TCP communications over port 9191 are allowed by your firewall
- The port that the PaperCut server has been configured to use matches the port in the URL
Step Two
Download and install PRTG Network Monitor on this server. When done, it should automatically open up its web interface, and start auto-discovering objects in your environment visible over the network.
It may look something like this:

Step Three
Add in a “device” This will help to organise the interface, providing a place to add all the needed sensors.
Either:
- Identify your PaperCut server in this structure,
or - if the server has not been auto-detected, click Add Device to manually add it.
In the screenshots below, the network device (components PRTG discovers on your network) has been removed to make it cleaner to look at for this walk through.
Right-click “127.0.0.1”; then select Add Device from the menu.

Give the new device a descriptive name, and provided the relevant IP Address/DNS Name for reaching it.
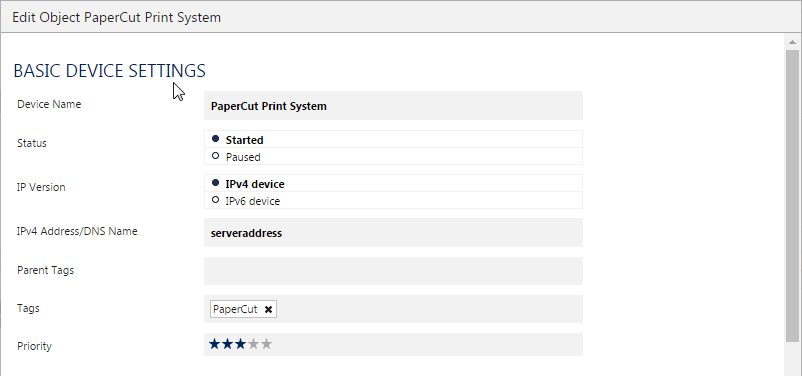
Now you have added the device, it should look like this:

Step Four
Time to add in a sensor so we can monitor the utilization of Papercuts’ allocated memory.
Click your server.
Click “Add Sensor”.
This is where you configure the particular element you want to monitor.
In the Search box at the top of the page, enter XML/REST to filter the list of available sensor types down to the one you want.

Click Add this to open the sensor settings dialog.
The following fields will need to be filled out.
Sensor Name:- The title of the sensor
URL:- The base address of the endpoint we want to monitor
XML Node (and optional property):- enter the node descriptor/property
**HTTP Headers:-**the Authorization key copied from copied from Options →Advanced →System Health Monitoring section
Unit String:- Allows us to see the value in its true form
For this walk though add the following sensor settings:
Sensor Name:- PaperCut Internal Memory Usage
URL:- http://servername:9191/api/health
XML Node (and optional property):- systemMetrics/jvmMemoryUsedPercentage
HTTP Headers:- add in your Authorization key
Unit String:- Change to “%”
See below then Click Continue.

Once added, the new sensor is gray but don’t despair, that will go away.
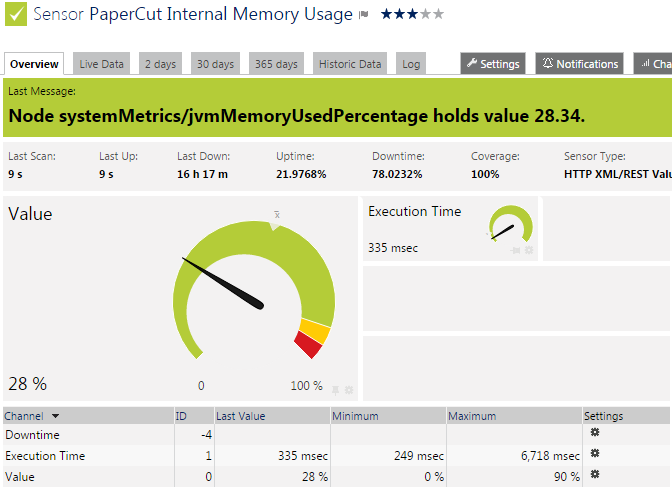
After about 60 seconds, if the URL is correct, the sensor changes to green.

Clicking the sensor will present you with a green meter displaying the current usage:

This is not as informative as it could be. To enhance the readability when we look at it, we need to set-up warnings and limits. Click on the large Value’ section of the screen Enable the Limits section at the bottom of the screen and for our purposes change:
*Upper Error Limit (%) to 95
*Upper Warning Limit (%) to 90
You can also add error and warning messages in that will be meaningful to you.

The sensor should look a little more readable, and allow you to instantly see if there is something amis.
Step Five
You’re doing well—it’s nearly coffee time, but before then, you had better make sure that if you’re busy doing stuff, your server will let you know that things have got rough.
Click on the PaperCut Internal Memory Usage Sensor
Click the Notifications tab.
Click Only use the triggers defined below.
Click the Add State Trigger button.

Set the values to meet your needs.

Step Six
Set-up your internal email server if you need to.
PRTG has the ability to email you the notification above directly “out of the box”, however if you want to use your own internal SMTP server:
Click Setup tab. Select System Administrator → Notification delivery.

In SMTP Delivery Mechanism, select Use SMTP relay server.
Enter your SMTP server settings in the following fields:
SMTP Relay Server
SMTP Relay SMTP Port
SMTP Relay Authentication
Adjust other fields as needed

You can test the new email server settings by pushing a test notification:
Click Setup → Account Settings →Notifications.
In the Email and push notification to admin section, click Test.

If you don’t receive the test email notification, check the Logs tab to work out what might be wrong with your SMTP settings!
Explore more endpoints
These indepth collectors can give you unprecedented views into your system, giving you instant warnings for any major issues that might arise, along with data to allow you to analyse the working state of your system.
For more endpoints, including printers and statistics, see the PaperCut Manual.
Category: How-to Articles
Subcategory: Monitoring
Comments