
This is a story about two separate datasets – regular printing and specialty printing – and one troublesome request:
Is it possible to report on both as one?
It’s a tale wherein almost anything’s possible with a few SQL tricks up your sleeve, the know-how to navigate the PaperCut database schema, and our fancy new reporting feature.
Let’s jump in!
Prologue
Yours truly and the Technical Services team
As a proud PaperCutter in the Technical Services team, I regularly point PaperCut’s channel partners in the right direction.
This involves helping them get the most out of scripting and reporting by way of product education (Technical Certification Programs and the like).
Specialty printing data in PaperCut
PaperCut’s workflow tool for 3D and specialty printing (formerly known as Job Ticketing) provides a simple interface for operators to easily organize the barrage of job requests from print rooms and FabLabs.
It also integrates with PaperCut MF’s users, shared accounts, and balances. So when jobs are submitted and printed:
- a user is charged an amount either automatically estimated via a cost script or specified by the operator; and
- the charged amount appears as a transaction in PaperCut MF (hang on to that nugget for later).
Still with me? Excellent. Let’s get back to the crux.
Part 1: Two datasets in one report – fact or fiction?
Let’s say fact with a few twists
If an organization has a FabLab or print room, plus a fleet of everyday-use MFDs, surely it’s easy to see cost recovery with a PaperCut MF built-in report?
Sigh. Sadly, it’s not that easy. But fret not: It’s entirely possible with a bit of clever thinking and SQL-ing. First, let’s check out the request putting us to the test.
The request
A curious manager wants to produce a report showing two things:
- The number of people printing, copying, scanning, and faxing; and
- The departments and faculties people are charging to (our ‘Shared account print/copy/scan/fax – breakdown’ report is perfect for this).
The kicker? They want 3D printing, CNC milling, and booklet printing included in the breakdown as well. Great.
Actually, it is great. Because our new reporting feature can save the day.
Custom Reports to the rescue
Even with PaperCut’s giant collection of detailed reports , there’s always going to be specific data sought by a specific manager in a specific department that isn’t covered on the reporting front.
With release 19.1, however, we’ve come pretty close to a solution in Custom Reports (definitely have a read if this announcement has you bouncing off the walls).
The short of it? You can now embed JasperReports with custom SQL into the PaperCut Application Server – and it’s awesome. And we’ll come back to it soon.
Jasper the friendly solution
With embedded JasperReports, you can one-click the report without having to open specific reporting software. You can even schedule the report right in PaperCut.
Basically, if you wanted to, you could:
- write a custom report in SQL
- format it in Jasper
- install the report file on the customer’s app server; and…
Boom! There it is: a new tab in the Reports section. Reports are natively supported in PaperCut as well, so you don’t have to install anything else on the server.
Now for the juicy stuff.
Part 2: How to unify two datasets for one report
Heads up! Skip over this part if you’re not interested in the nitty gritty of writing a custom report. Better yet, yell out for your favourite techie to come read it.
Using the right source report
To start, grab the source SQL of the built-in report we mentioned before (‘Shared account print/copy/scan/fax – breakdown’).
Hot tip: we publish the SQL of all our reports, so all you wizards who dive right into custom reporting should definitely bookmark that link above.
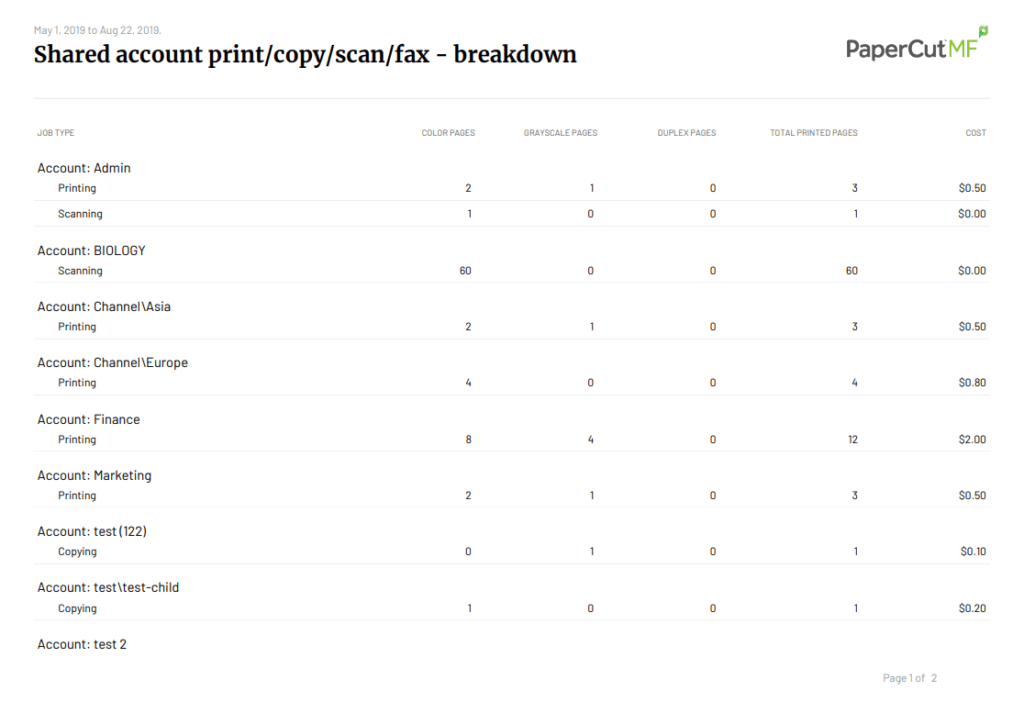
A sample of the ‘Shared account print/copy/scan/fax – breakdown’ report. Gorgeous, ain’t she?
You’ll see this report grabs information from the Job Log, which is where data gets plopped when anyone prints, copies, scans, or faxes.
It’s also where things get tricky:
On top of being stored in a separate database, every specialty print log is accounted for in the PaperCut MF database as a transaction (remember those?).
So how do we mash specialty print information into a report that does all its work in the Job Log, and has no business in the Transaction Log?
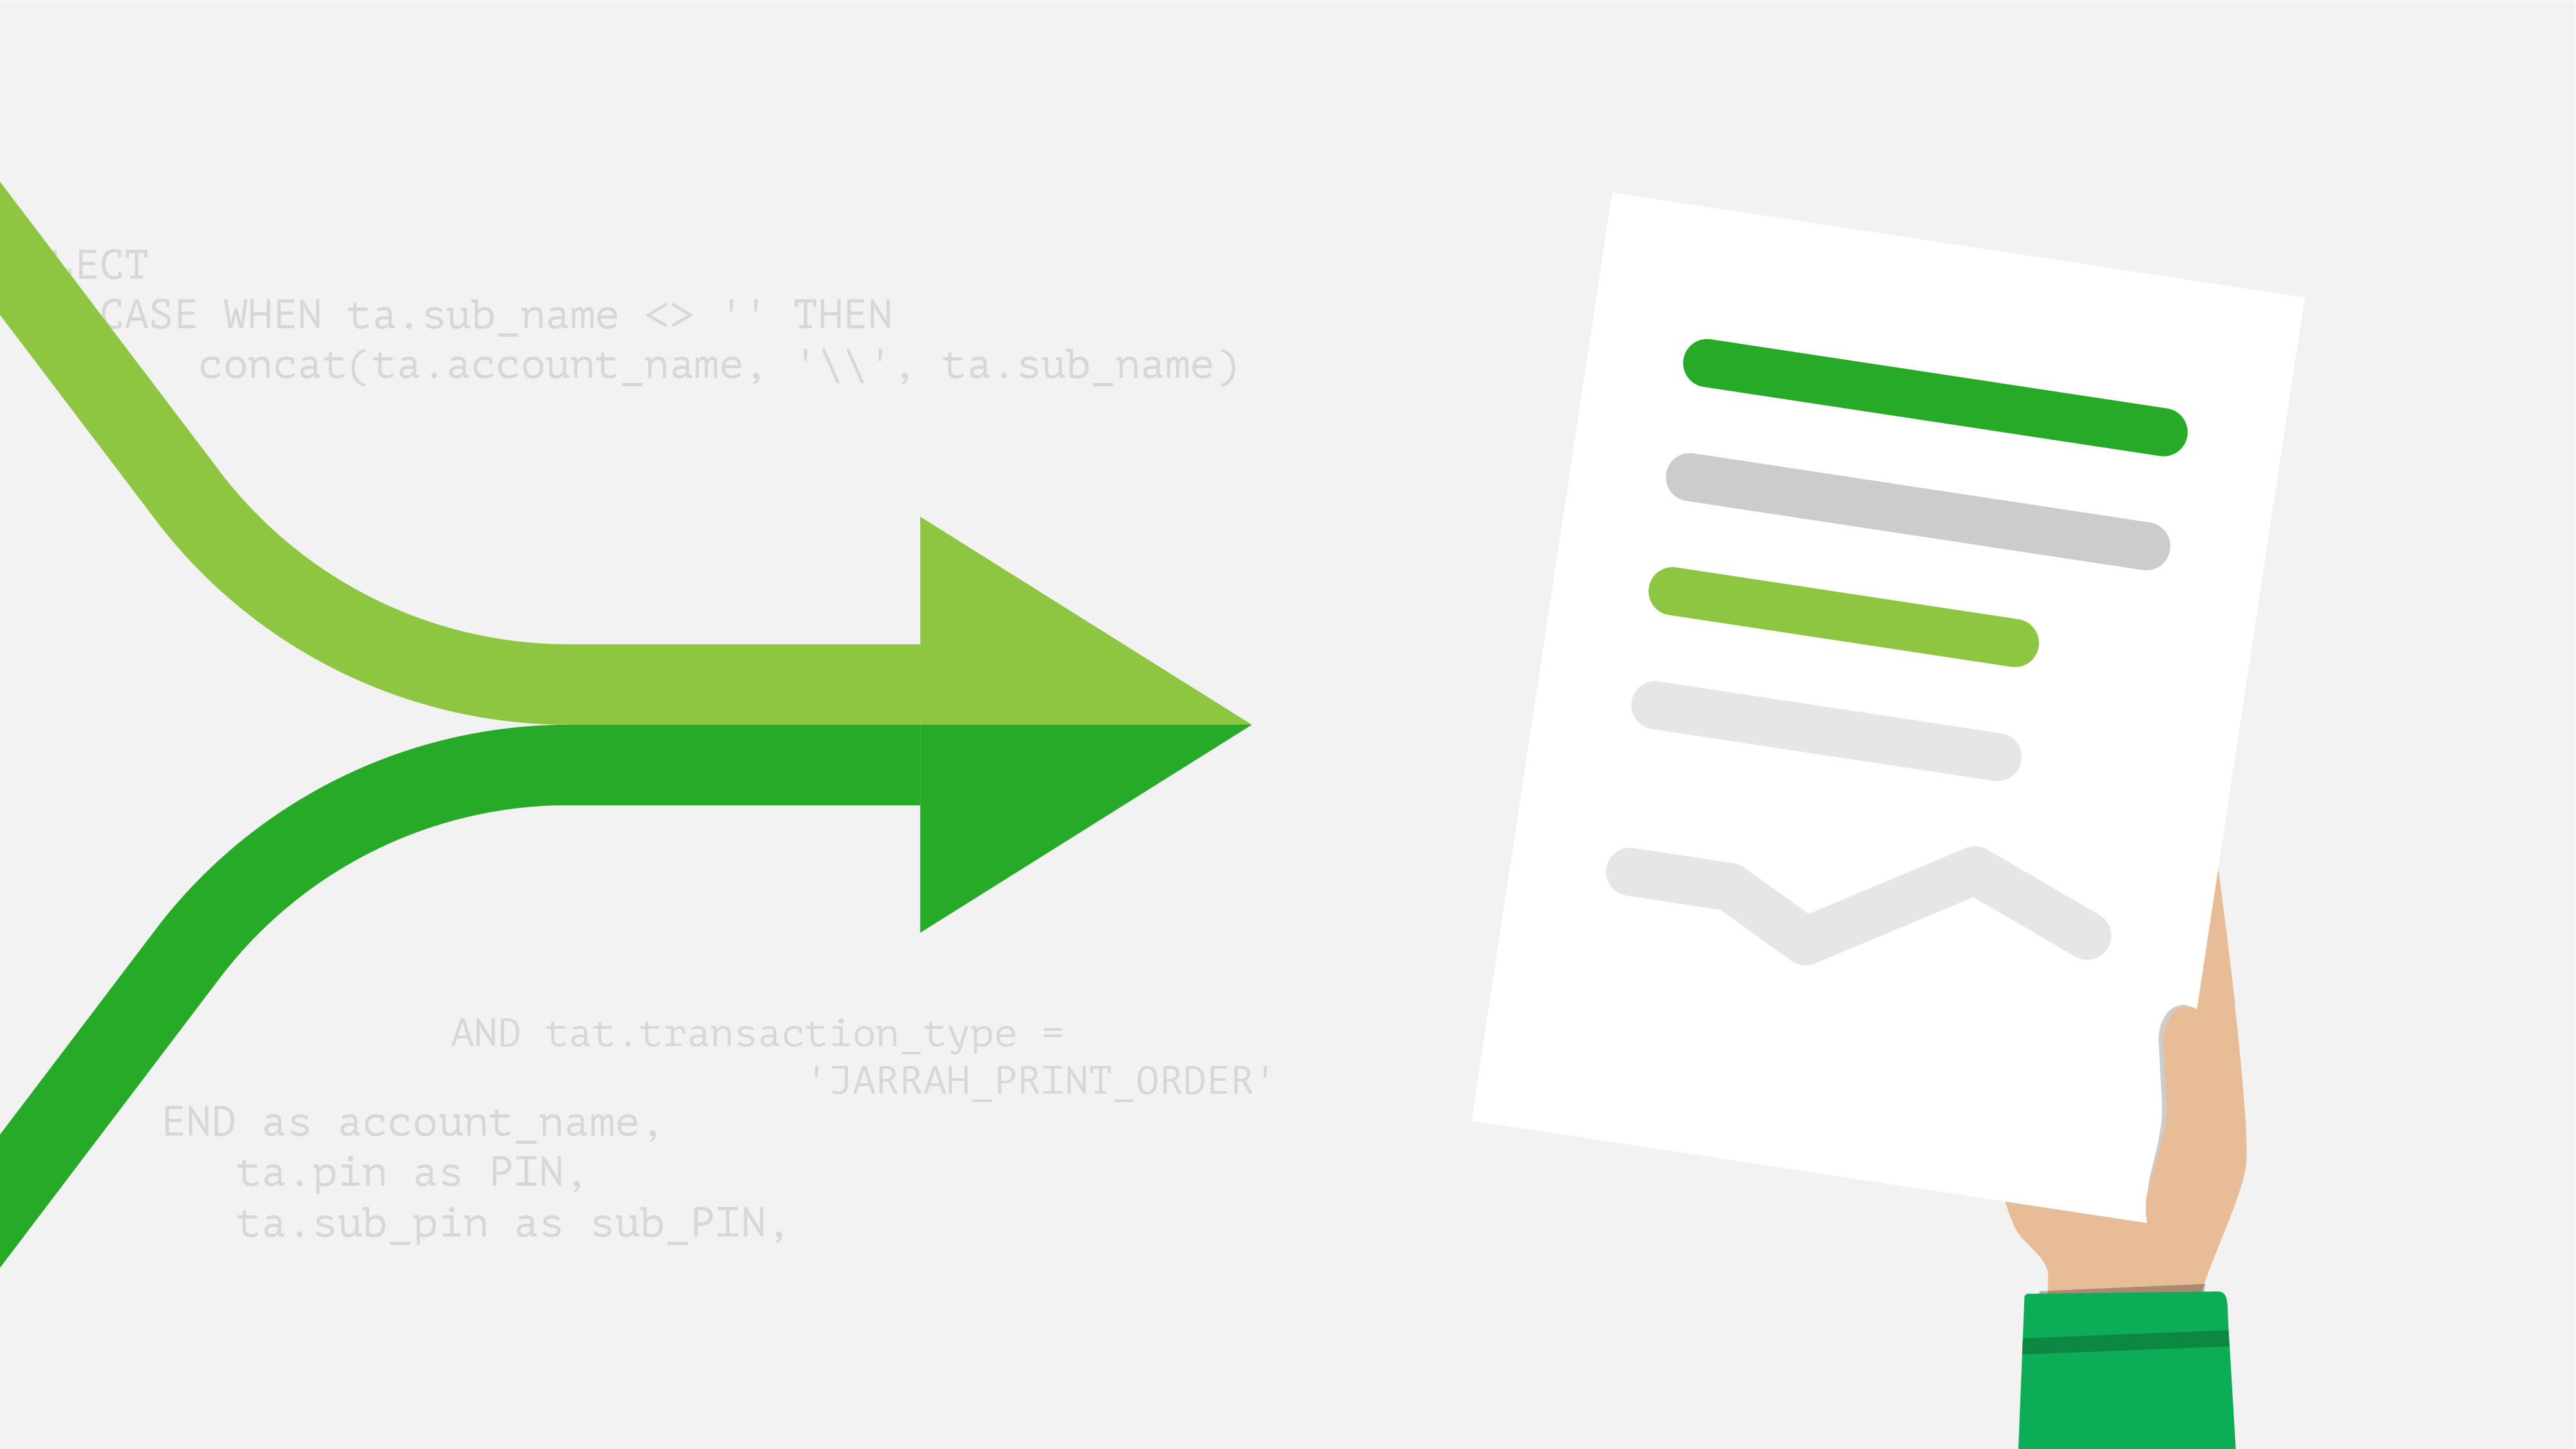
An “SQL-egant” solution
Remember when I mentioned SQL tricks at the outset? We made it, y’all. We made it. Here’s what you need to do:
- Write two SQL queries that produce the same layout of results – one from the Job Log, and one from the Transaction Log; and
- Smoosh (term coined by Damien, Global Technical Services Manager) these two ways of storing completed jobs together with a UNION statement, which makes them play (and look) nice together.
Here’s the source SQL of the original PaperCut report for print, copy, and scan by account (don’t ask why I decided on PostgreSQL):
SELECT
	CASE WHEN ta.sub_name <> '' THEN
		concat(ta.account_name, '\\', ta.sub_name)
	ELSE
		ta.account_name
	END as account_name, --handle sub-accounts
	ta.pin,
	ta.sub_pin,
	ta.balance,
	tpul.job_type,
	sum(tpul.total_pages) as total_pages,
	sum(tpul.usage_cost) as usage_cost,
	sum(tpul.total_color_pages) as total_color_pages,
	sum(tpul.duplex_pages) as total_duplex_pages,
	count(*)  as total_jobs
FROM
	tbl_printer_usage_log tpul
	JOIN tbl_account ta on ta.account_id = tpul.assoc_with_account_id
WHERE
	ta.account_type = 'SHARED'
	AND tpul.usage_date > (NOW() - interval '1 year')
	AND tpul.refunded = 'N'
	AND ((tpul.job_type = 'PRINT' and tpul.printed='Y') OR tpul.job_type != 'PRINT')
GROUP BY
	ta.account_type,
	ta.account_name,
	ta.sub_name,
	ta.pin,
	ta.sub_pin,
	ta.balance,
	tpul.job_type
ORDER BY
	ta.account_type,
	ta.account_name,
	ta.sub_name,
	tpul.job_type;
Here’s the resultant output:
<table class=“wp-block-table”><tbody><tr><td><strong>account_name</strong></td><td><strong>balance</strong></td><td><strong>job_type</strong></td><td><strong>total_pages</strong></td><td><strong>usage_cost</strong></td><td><strong>total_color_pages</strong></td><td><strong>total_duplex_pages</strong></td><td><strong>total_jobs<br></strong></td></tr><tr><td>Admin</td><td>-0.5</td><td>PRINT</td><td>3</td><td>0.5</td><td>2</td><td>0</td><td>1</td></tr><tr><td>Admin</td><td>-0.5</td><td>SCAN</td><td>1</td><td>0</td><td>1</td><td>0</td><td>1</td></tr><tr><td>BIOLOGY</td><td>-3.1</td><td>SCAN</td><td>60</td><td>0</td><td>60</td><td>0</td><td>6</td></tr><tr><td>Channel\Asia</td><td>-5.5</td><td>PRINT</td><td>3</td><td>0.5</td><td>2</td><td>0</td><td>1</td></tr><tr><td>Channel\Europe</td><td>-24.95</td><td>PRINT</td><td>4</td><td>0.8</td><td>4</td><td>0</td><td>1</td></tr><tr><td>Finance</td><td>-2</td><td>PRINT</td><td>12</td><td>2</td><td>8</td><td>0</td><td>4</td></tr><tr><td>Marketing</td><td>-0.5</td><td>PRINT</td><td>3</td><td>0.5</td><td>2</td><td>0</td><td>1</td></tr><tr><td>test</td><td>-0.1</td><td>COPY</td><td>1</td><td>0.1</td><td>0</td><td>0</td><td>1</td></tr><tr><td>test\test-child</td><td>-0.2</td><td>COPY</td><td>1</td><td>0.2</td><td>1</td><td>0</td><td>1</td></tr><tr><td>test 2</td><td>-0.6</td><td>SCAN</td><td>2</td><td>0.2</td><td>2</td><td>0</td><td>1</td></tr></tbody></table>
And here’s my SQL query to pull specialty print transactions and job type (CNC milling, booklet printing, and so on) from the Transaction Log and present them in the same layout.
SELECT
	CASE WHEN ta.sub_name <> '' THEN
		concat(ta.account_name, '\\', ta.sub_name)
	ELSE
		ta.account_name
	END as account_name,   --handle sub-accounts
	ta.pin as PIN,
	ta.sub_pin as sub_PIN,
	ta.balance as balance,
	SUBSTRING(tat.txn_comment, '.*\-\s\#\d{4,}\s\-\s(.*)\s\-') as job_type,
	0 as total_pages,
	sum(tat.amount) as usage_cost,
	0 as total_color_pages,
	0 as total_duplex_pages,
	count(*)  as total_jobs
FROM
	tbl_account_transaction tat
	JOIN tbl_account ta on ta.account_id = tat.account_id
WHERE
	ta.account_type = 'SHARED'
	AND tat.transaction_date > (NOW() - interval '1 year')
	AND tat.transaction_type = 'JARRAH_PRINT_ORDER'
GROUP BY
	ta.account_type,
	ta.account_name,
	ta.sub_name,
	ta.pin,
	ta.sub_pin,
	ta.balance,
	job_type
ORDER BY
	ta.account_type,
	ta.account_name,
	ta.sub_name,
	job_type;
Here’s the resultant output:
<table class=“wp-block-table”><tbody><tr><td><strong>account_name</strong></td><td><strong>balance</strong></td><td><strong>job_type</strong></td><td><strong>total_pages</strong></td><td><strong>usage_cost</strong></td><td><strong>total_color_pages</strong></td><td><strong>total_duplex_pages</strong></td><td><strong>total_jobs</strong></td></tr><tr><td>Channel\Asia</td><td>-5.5</td><td>3D print</td><td>0</td><td>-5</td><td>0</td><td>0</td><td>1</td></tr><tr><td>Channel\Europe</td><td>-24.95</td><td>3D print</td><td>0</td><td>-10</td><td>0</td><td>0</td><td>2</td></tr><tr><td>Channel\Europe</td><td>-24.95</td><td>Document</td><td>0</td><td>-14.15</td><td>0</td><td>0</td><td>1</td></tr></tbody></table>
We can see that:
- account Channel\\Asia has one 3D print processed; and
- Channel\\Europe has two 3D prints processed, plus one Document processed (similar to the original report where we saw print, copy, and scan jobs in the same layout).
And that means we have two queries that produce the same layout. Nice! Now we just need them to display their datasets harmoniously together as if that’s what they were designed to do in the first place.
Weaving it together with a UNION statement
Not sure how to make a beautiful custom reporting union? Not to worry – I’m a certified celebrant. Here’s the gist:
SELECT
[column names consistent in both queries]
FROM
(
QUERY 1

UNION

QUERY 2
)
ORDER BY
[how you’d like to order things]
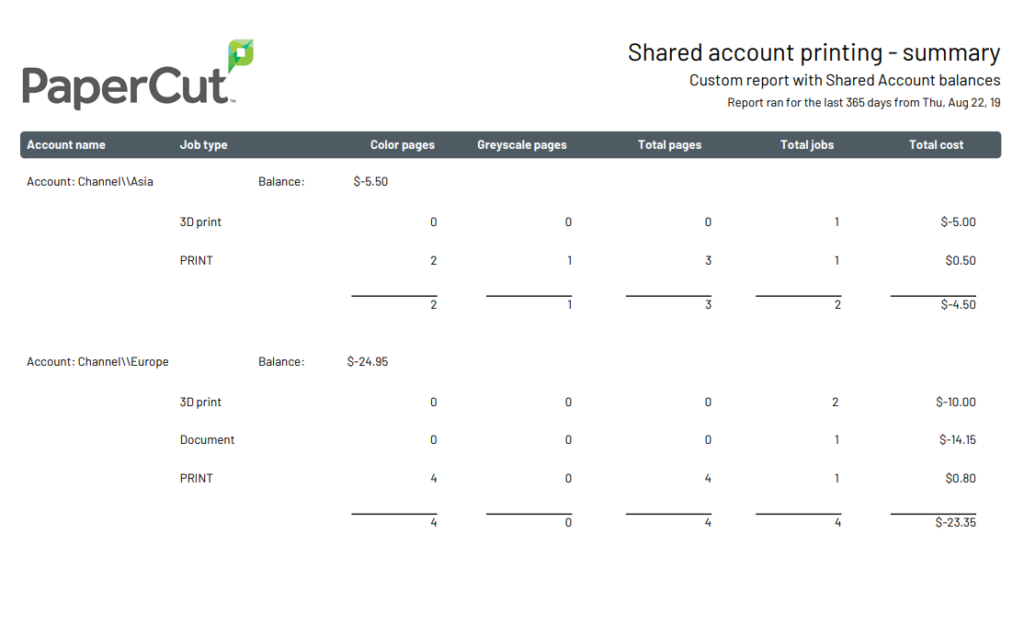
And voila! Our queries are happily smooshed together to produce the following glorious output:
<table class=“wp-block-table”><tbody><tr><td><strong>account_name</strong></td><td><strong>balance</strong></td><td><strong>job_type</strong></td><td><strong>total_pages</strong></td><td><strong>usage_cost</strong></td><td><strong>total_color_pages</strong></td><td><strong>total_duplex_pages</strong></td><td><strong>total_jobs</strong></td></tr><tr><td>Admin</td><td>-0.5</td><td>PRINT</td><td>3</td><td>0.5</td><td>2</td><td>0</td><td>1</td></tr><tr><td>Admin</td><td>-0.5</td><td>SCAN</td><td>1</td><td>0</td><td>1</td><td>0</td><td>1</td></tr><tr><td>BIOLOGY</td><td>-3.1</td><td>SCAN</td><td>60</td><td>0</td><td>60</td><td>0</td><td>6</td></tr><tr><td>Channel\Asia</td><td>-5.5</td><td>3D print</td><td>0</td><td>-5</td><td>0</td><td>0</td><td>1</td></tr><tr><td>Channel\Asia</td><td>-5.5</td><td>PRINT</td><td>3</td><td>0.5</td><td>2</td><td>0</td><td>1</td></tr><tr><td>Channel\Europe</td><td>-24.95</td><td>3D print</td><td>0</td><td>-10</td><td>0</td><td>0</td><td>2</td></tr><tr><td>Channel\Europe</td><td>-24.95</td><td>Document</td><td>0</td><td>-14.15</td><td>0</td><td>0</td><td>1</td></tr><tr><td>Channel\Europe</td><td>-24.95</td><td>PRINT</td><td>4</td><td>0.8</td><td>4</td><td>0</td><td>1</td></tr><tr><td>Finance</td><td>-2</td><td>PRINT</td><td>12</td><td>2</td><td>8</td><td>0</td><td>4</td></tr><tr><td>Marketing</td><td>-0.5</td><td>PRINT</td><td>3</td><td>0.5</td><td>2</td><td>0</td><td>1</td></tr><tr><td>test</td><td>-0.1</td><td>COPY</td><td>1</td><td>0.1</td><td>0</td><td>0</td><td>1</td></tr><tr><td>test 2</td><td>-0.6</td><td>SCAN</td><td>2</td><td>0.2</td><td>2</td><td>0</td><td>1</td></tr><tr><td>test\test-child</td><td>-0.2</td><td>COPY</td><td>1</td><td>0.2</td><td>1</td><td>0</td><td>1</td></tr></tbody></table>
So now we have an SQL query that produces an organized dataset from both PaperCut and our specialty printing workflow tool.
Thing is, it’s not all that useful to a manager who wants a pretty report. So how can we leverage PaperCut’s new Custom Reports feature to beautify this haggard thing?
Part 3: Reports as ravishing as they are customizable
PaperCut’s Custom Reports have been designed to natively consume jrxml (JasperReports files), and render them through the standard PaperCut interface as either PDF or HTML. They can also look downright fancy.
Here’s how:
- Create a new JasperReport to house your newly written SQL.
- Tinker with it in Jaspersoft Studio to meet your beauty standards.
- Save the report.
- Edit variables, headings, and custom company logos.
- Save the file and copy it straight into the PaperCut Custom Reports directory: [app-server]\server\reports\custom\jasper.
So here’s what you’ll see in your PaperCut Admin interface:
![]()
Just one click away from the Fabio of reports
And here’s what your report can look like after it’s been schmick’d up in Jaspersoft Studio, and generated in PaperCut MF (by hitting the PDF icon pictured above):
MAGNIFIQUE!
Looks like a pretty tidy report, right? You betcha.
Epilogue
So there you have it. Different datasets mingling to make top-shelf data babies. And that’s just the tip of the Custom Reports iceberg.
Basically, anything you whip up in Jaspersoft Studio using the PaperCut database can be slid into PaperCut MF/NG to satisfy finance, IT, and beyond.
Written a custom report for us in the past, used report-designing software, or simply have some ideas for Custom Reports ? We’d love to hear from you in the comments.
