
So you’ve been using the PaperCut MF solution for some time, and it’s working really well for you. But in the current economic climate, you’re being challenged to find even more cost savings in your IT budget right now.
It’s already well known that many organisations overlook print spending as a major culprit that can eat into IT budgets, leaving less room for innovation and value-added projects.
Did you know that on average businesses waste 14 percent of their revenue on document and print-related inefficiencies? Just imagine what you could accomplish with 14 percent of your IT budget back?
So how can Intuitive for PaperCut MF help?
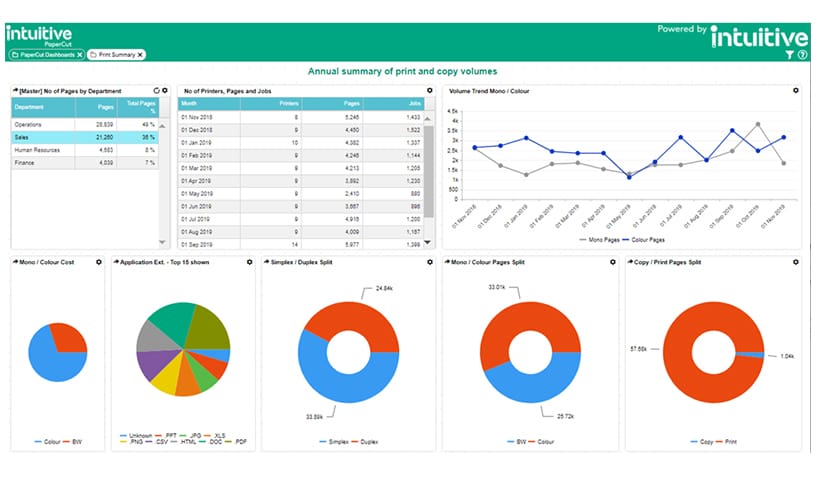
Intuitive for PaperCut MF takes advantage of the Data Integration feature in PaperCut 20.0 and provides a pre-integrated BI solution that works alongside PaperCut MF.
Regular reports for different budget holders are automated and personalized with no effort. The visual dashboards have been designed to identify where you can improve the efficiency of your print infrastructure.
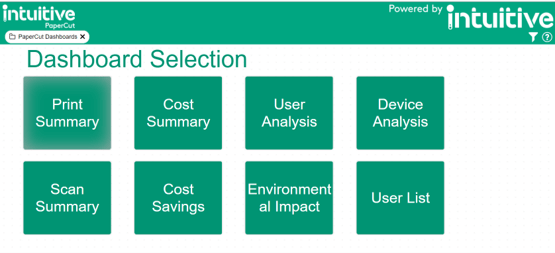
Here are just three of the ways that we can help you make better decisions about your print estate.
1. Identify expensive print hotspots
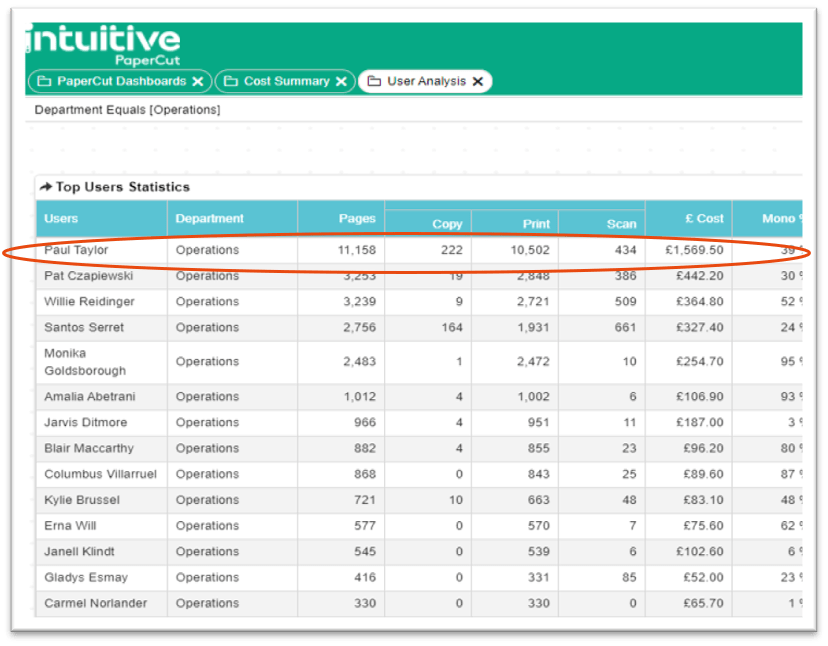
In just a few simple clicks from the Cost Summary dashboard, you can identify the biggest users of print by department and by different print types (eg. PDF, XLS, DOC).
With a further click you can drill down into the detail and see which users are printing the most pages. No scrolling through lengthy PDF reports to find the culprits!
Armed with this information, you can use the super features in PaperCut to recommend that users print in black and white only, control settings so that they only print in colour when needed, or even introduce quotas (and charging options).
2. Find out which devices are being used most for colour printing
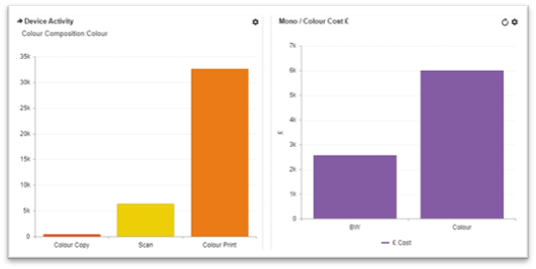
By looking at the Device Analysis dashboard, you can see immediately where expensive colour printing is taking place (for example on a high cost departmental inkjet). You can then look to transfer this printing to lower cost devices (such as a central MFD) with a lower colour print cost per page.
3. Where can I rationalise my print estate?
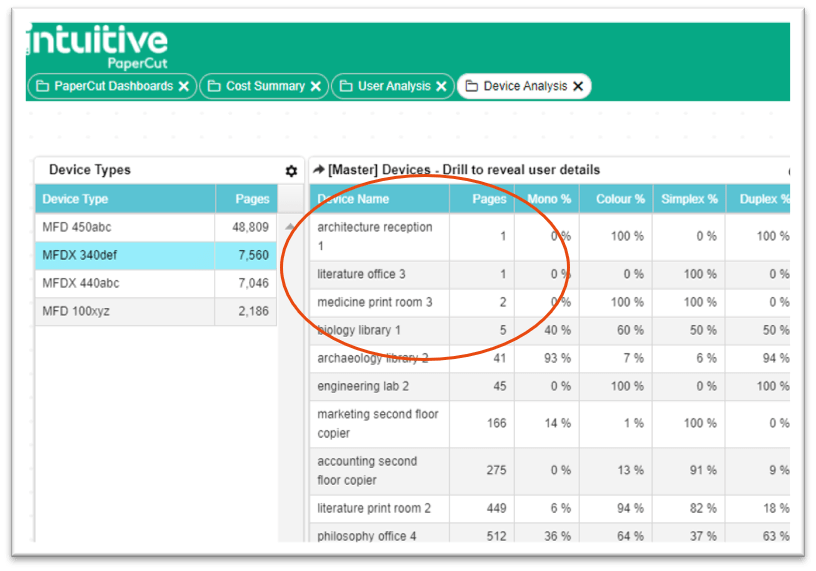
The Device Analysis dashboard can also show which devices are over and underused so that you can save costs. With one simple click, the dashboard shows how many pages each device has printed in the last 12 months. This allows you to review your print estate and consolidate to save costs where it’s appropriate.
Interested to find out more?
Contact your local ASC for a demonstration. Once you’ve seen that, you’ll be pleased to know that Intuitive for PaperCut can be installed with a complete set of standard configurations in less than ½ a day. And it can reside on the same server as PaperCut too!