Simple Health Monitoring using Zabbix
THE PAGE APPLIES TO:
In PaperCut 16.1, we’ve enhanced the Print System Health interface.
Maximize your print uptime by proactively maintaining your print environment using Zabbix. You can:
- Trigger alarms as soon as outages occur rather than waiting for someone to report an issue
- monitor real-time printing activity to identify changes in printing behavior
- monitor trends in printing resources and usage over time so you can plan for expansion to address bottlenecks before they occur.
- monitor printer and device inactivity
NOTE: You may also be interested in the advanced option over here: https://www.papercut.com/kb/Main/SystemHealthZabbix
For SysAdmins who have not set up monitoring before, we’ve put together this simple print system monitoring article to take you through the setup.
This method of monitoring provides an Up/Down status by returning HTTP response status codes
- 200 = OK
- 500 = Error
For more information on the types and use of these URLs (endpoints), see the PaperCut manual.
To demonstrate using Zabbix Monitoring Tool and the simple Print System Health interface, you will set up Zabbix to monitor the overall state of your print environment.
You should get a green [ok] or red [error] status from Zabbix once you have finished.
To achieve this you need to complete a few overall tasks:
- Check your server access
- Download and install Zabbix on an appropriate server.
- Create a host as a container to create your endpoints.
- Create a Web Scenario and define steps to monitor status endpoint(s) of the PaperCut application server.
- Set up notifications.
- Configure the mail server settings in Zabbix.
Step One - Check your server access
Pick a server in your environment that has network visibility of the PaperCut server you want to monitor.
Put simply, the server needs to be able to successfully access this URL: http://serveraddress:9191/api/health/license/status
The System Health interface URLs are secured with an authorization key. You can get your unique authorization key under ‘Options > Advanced’. Use the key as follows:
GET query parameterhttp://serveraddress:9191/api/health/license/status?Authorization=<your unique key>
HTTP headerAuthorization:<your unique key>
If you’re running PaperCut 16.1 or later, the server is online, and you can’t access this URL, check that:
- The hostname can be resolved by your DNS (or that the IP address is correct)
- TCP communications over port 9191 are allowed by your firewall
- The port that the PaperCut server has been configured to use matches the port in the URL
Step Two - Download and install Zabbix
Download and install Zabbix on this server. When done, log in to the Zabbix administration page at:- http://<server ip or hostname>/zabbix

Step Three - Create a host
From the Zabbix dashboard:
- Select ‘Configuration > Hosts’.
- Click ‘Create Host’.

- Create the host that corresponds to your PaperCut Application Server.
- Change the Port to 9191.

Once you have created a host, you need to create an application within the Zabbix framework. Within Zabbix, applications are used to group items in logical groups.
- From the Zabbix dashboard, select: Config > Hosts > [Host Created Above] > Applications.
- Click Create Application.

Step Four - Create a Web Scenario and define steps
The PaperCut System Health interface provides you with the flexibility to choose the level of detail you want to monitor. The highest level you should monitor is the overall summary status of your PaperCut NG system health.
The endpoint for this status check is:
http://<server ip address or hostname>:9191/api/health/status
This URL returns an error (HTTP status code 500) when one or more of the following conditions occur:
- The Application server cannot connect to the database
- The number of active database connections is greater than 90%
- Less than 1 GB available disk space
- An invalid license is in use
- Site Server is offline
Now you’ll create a web scenario. A web scenario consists of one or more HTTP requests or “steps”. The steps are periodically executed by the Zabbix server in a predefined order.
- From the Zabbix dashboard, select Configuration > Hosts > [Host Created Above] > Web Scenarios.
- Click Create Web Scenario.

Before you complete your web scenario, create a step that will poll the status endpoint.
- Click Steps > Add. (opens in a new window)
- Enter the name of the step (just a text label).
- Paste the status URL that you chose from the list of endpoints, e.g.
http://localhost:9191/api/health/application-server/status?disk-threshold-mb=1024 - Click Add.

Note: Remember to substitute localhost with the IP address or domain name of your PaperCut server.
Your step has been added to your new web scenario.
To complete the new Web Scenario, click Add, or click Update if the Web Scenario was previously added.

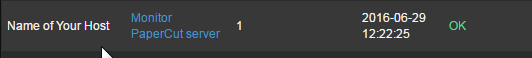
To check the status of your newly created web scenario, select Monitoring > Web.
You should see your monitor listed below.
You’re doing well—it’s nearly coffee time, but before then, you had better make sure that if you’re busy doing stuff, your server will let you know that things have got rough.
Step Five - Set up notifications
In this step, you will tell Zabbix when to notify you and also configure your mail server so that Zabbix can email you.
Create alarm triggers
A trigger is the event that triggers email notifications. Triggers are built using an expression.
To create a trigger.
- Select Configuration > Hosts > Host Name > Triggers.
- Click Create trigger.

In this example, since you are using a web scenario, you want to create a trigger for when the web scenario code is anything other than a success based on the HTTP status code. Use the following expression: {Host_as_set_in_zabbix:web.test.fail[web_scenario_name].last()} <> 0
Once this is done, you can set the severity. For example, a printer error might be better off as a warning and the Application Server would be a disaster.

Step Six - Set up email notifications
Set the email for your user account:
- In the top right of the page, click the user icon.

- Click Media.
The When Active field defaults to 7 days a week, 24 hours a day.

- Specify when you want the email to be sent and the severity of the email. You can set up multiple emails for the same user and set a different severity level for each one.
Set up the mail server
- Select Administration > Media Types > Email.

- Enter the details of your mail server.

Well done! You should now receive an email notification when your print environment requires your attention. Next step, explore the other endpoints available in PaperCut NG here, and configure more Web Scenarios to get the level of coverage you want.
Categories: How-to Articles , Monitoring
Last updated March 15, 2024
Comments