PaperCut Data Integrations (available now in PaperCut MF v20.1 ) provide a great opportunity to find out how the data generated within your PaperCut system can give you insights into printing behaviors within your organization.
Intuitive for PaperCut MF is the first application to take advantage of the PaperCut Data Integration features and provides a pre-integrated BI solution that works alongside PaperCut MF.
Regular reports for different budget holders are automated and personalized with no effort. And the visual dashboards have been designed to identify where you can improve the efficiency of your print infrastructure
Here are three of the interesting areas where Intuitive dashboards can give you insights
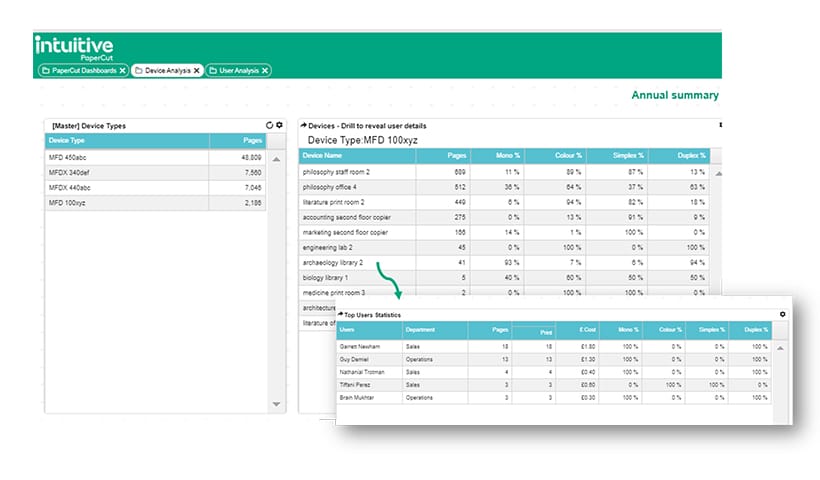
1. Which devices are under-used across our organization?
Using the Device Analysis dashboard we can quickly and easily show which departments are using a particular device type. This dashboard shows the volume printed by each device in this category and identifies under-used devices.
A further drill-down into the data, using a single click can show the individual users who are using this printer. Using this dashboard you can identify an under-utilized device, and perhaps look to move usage from an over-utilized device in another area?
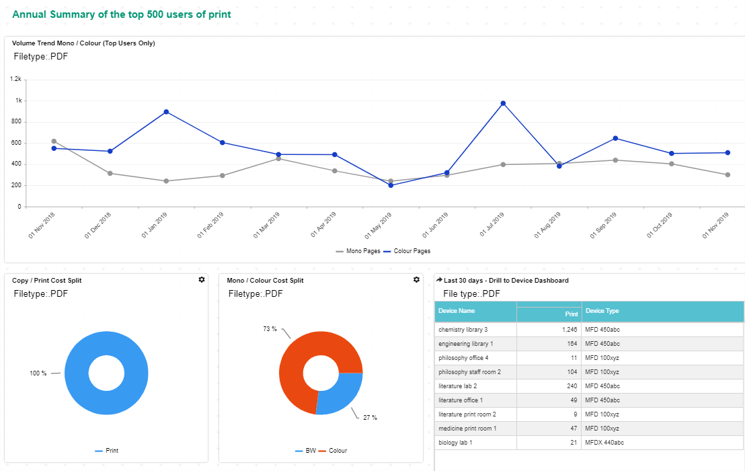
2. Which applications are driving print consumption?
Now, what if you could see which applications (PDF, DOC, XLS, etc) are driving print demand? And within that, see the top 500 users of print, analyzed by month, and broken down by mono/color?
This level of detail about the print behavior of users within your organization can help you to control costs and ensure appropriate print policies and rules are in place (using PaperCut MF of course).
3. What are Individual Print Users up to?
How would you like to be able to have a single page summary of an individual user’s printing behavior?
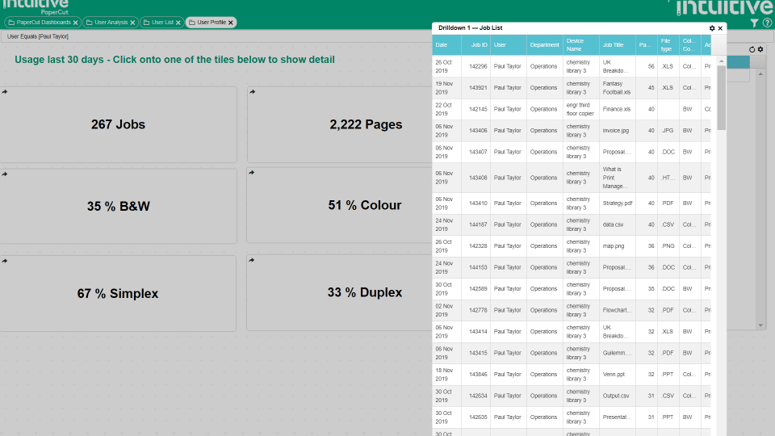
The User dashboard gives a summary view of what an individual user has been printing – broken down by print jobs, number of pages, mono/color split, and simplex / duplex split. And from here, it’s a simple one-click step to drill down into the detail of the documents printed.
We know of customers who’ve used this to identify all of the documents a recent leaver has printed – just to make sure they haven’t printed out your entire customer database or other confidential documents!
https://www.youtube.com/watch?v=QJzd_M8LgLQ
Interested to find out more about PaperCut Data Integrations with Intuitive?
Contact your local Authorized Solutions Center or Reseller for an Intuitive demonstration. Once you’ve seen that, you’ll be pleased to know that Intuitive for PaperCut can be installed with a complete set of standard configurations in less than ½ a day. It can reside on the same server as PaperCut too!
This guest blog post has been written by Catherine Kennedy, Partner Marketing Manager at Intuitive. Intuitive is PaperCut’s first data integration partner, and the solution is now available as part of PaperCut MF v20.1.